Benchmark

See whether the method you just changed is actually faster.
Benchmark times a method while the game is playing, then lays the result out so the comparison is obvious. Run it before a change, run it again after, and read the median. The previous run stays next to the new one, and every attempt from the session stays in History.
Use it when a method feels expensive and you want a number you can trust more than a single stopwatch call. Benchmark is part of Methods Studio.
What you get
| A typical time | The median, so one slow call does not decide the result |
| The shape of the run | Mean, fastest, slowest, and a P95 for the slow tail |
| A direct comparison | Faster or slower than the previous run of the same method |
| A picture | A distribution of the samples, with the median drawn across it |
| A session log | Every run for that method, so you can reopen an earlier result |
| A summary you can paste | One block of text for a note, a task, or a review |
Open a method
Benchmark does not show a second list of methods. You choose the method in the explorer, then open it in Benchmark.
Three ways:
- Right-click the method and choose Benchmark.
- Expand the method and use the benchmark button beside Open in scope. The same button appears when you hover the method name.
- Click the method, then select the Benchmark tab.
The tabs along the top of Methods Studio are Explorer, Benchmark, and Favorites.
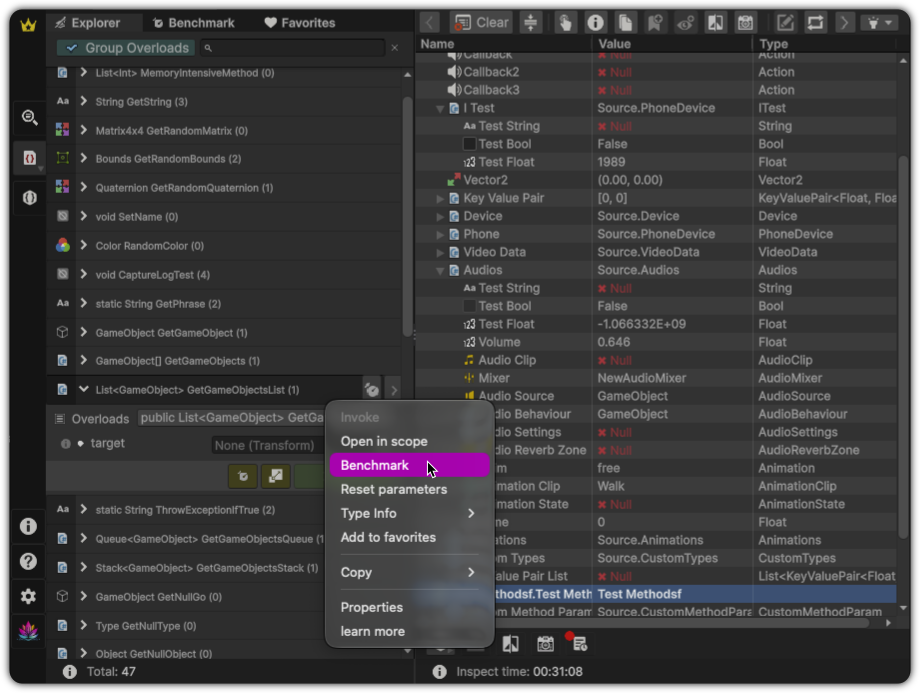
The panel opens on that method. The name and the full signature stay at the top, the same way a method looks when you open it in scope. Close returns you to the explorer. The runs you already made stay saved for the session.
Set up the run
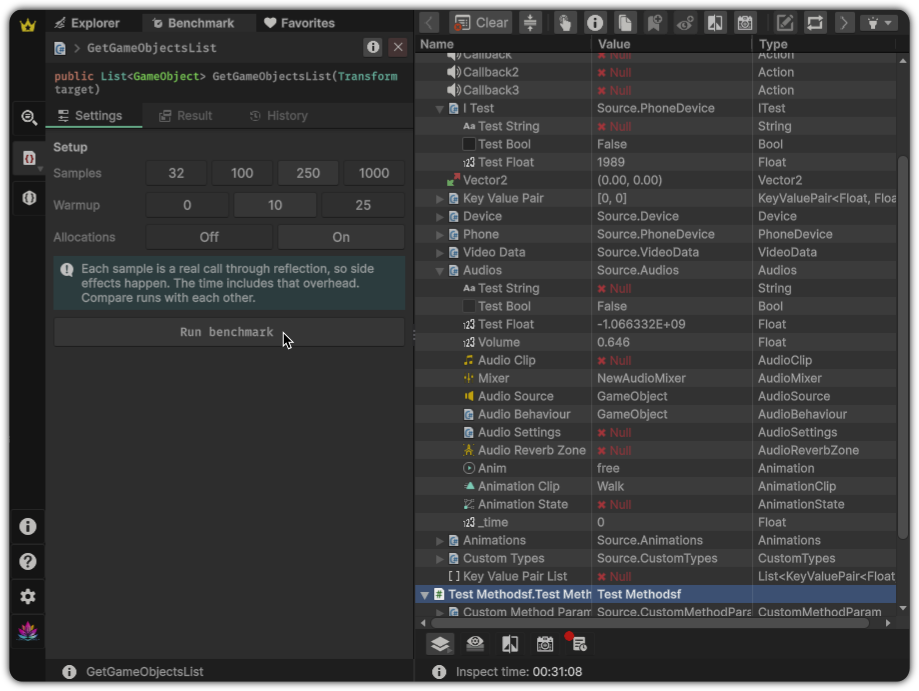
Settings is where you decide how thorough the run should be.
| Setting | What to choose |
|---|---|
| Samples | How many timed calls to take. 32 is a quick check. 100 is a solid default. 250 and 1000 are for a method you are about to commit to. |
| Warmup | Calls made before timing starts, so the first cold calls do not skew the result. 10 is a good default. Use 0 when you want the cold time included. |
| Allocations | On when you care about garbage as well as time. The amount is per call. |
A short note under the settings explains the two things worth remembering: the method really runs, so anything it changes in the game will happen, and the time includes the cost of calling it from InspectMe. Compare runs with each other.
If the method needs arguments, set them first with Open in scope. Benchmark uses those values. If the object is gone, the panel says so instead of timing a dead instance.
Enter play mode, then press Run benchmark.
Read the result
When the run finishes, Benchmark switches to Result.
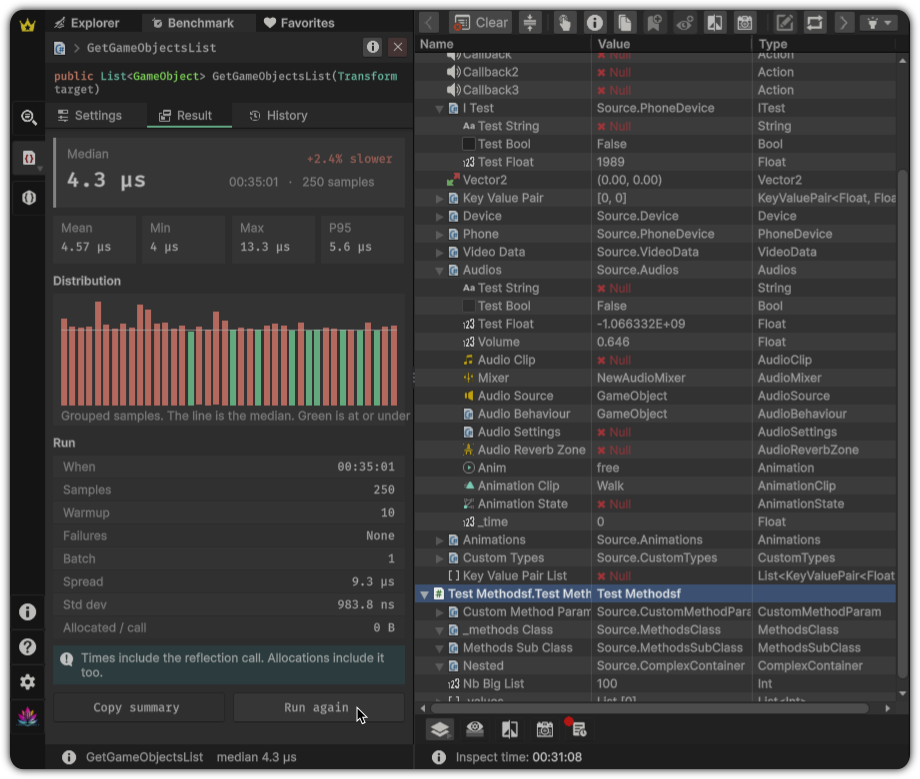
The large number is the median. That is the one to compare. Beside it, the previous run of this same method is summarized as faster, slower, or the first run.
Under that:
- Mean is the average. A few very slow calls pull it up.
- Min and Max are the fastest and slowest samples.
- P95 is a slow call that still sits inside the bulk of the run. It is the number to watch when the method is usually fine and occasionally hitches.
Distribution draws the samples as bars. Bars on the median or under it are green. Bars above it are warm. The line across the chart is the median. A tight cluster means the method is steady. A long warm tail means some calls are much slower than the typical one.
Run lists the practical details: when it ran, how many samples and warmup calls, how many calls failed, the spread between the fastest and slowest sample, how steady the times were, and the memory per call when allocations were measured.
Copy summary puts that result on the clipboard. Run again starts another test with the current settings.
History
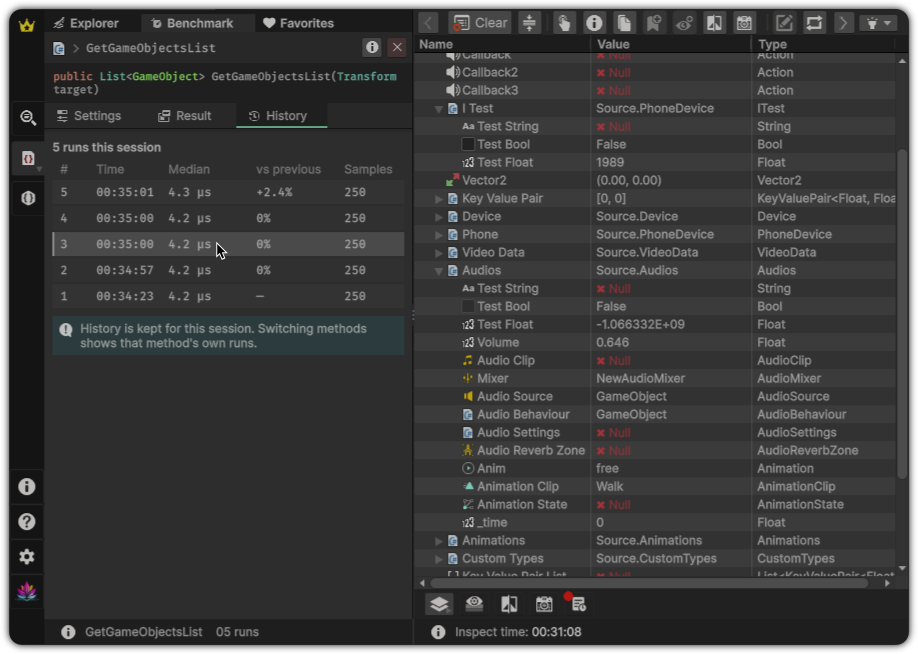
History is the log for the method you are looking at.
Each row is one run: its number, the time of day, the median, how it compared with the run before it, and how many samples it used. Select a row to open that result again. Latest on the result brings you back to the newest run.
History is kept for the rest of the session. You can switch to another method, benchmark that one, and come back. Each method keeps its own list. Leaving play mode does not clear it. Closing InspectMe, or restarting Unity, does.
A useful loop
- Find the method in the explorer and open it in Benchmark.
- Run it once and treat that median as the baseline.
- Change the method.
- Run it again.
- Read the median and the faster or slower label.
- If you want the earlier number back, open it from History.
That loop is the point of the feature. One run tells you what the method costs right now. Two runs tell you whether the change was worth it.
Good to know
- The method is really called. Side effects happen. Do not benchmark a method that spends money, saves over a file, or destroys something you still need.
- The measured time includes the cost of calling the method from InspectMe. A method that is already extremely short will show more of that cost. The useful question is still "is this version faster than the last one?"
- More samples make the median steadier. They also take longer and call the method more often.
- Failed calls are left out of the timing. If too many calls fail, the result says why instead of inventing a time.
- Allocations, when shown, include the call itself. Use them to compare runs, the same way you compare times.
- Benchmark runs in play mode. The button stays quiet until you press Play.
Editions
Benchmark is part of InspectMe Pro, starting with Pro 1.6.0.
Free and Lite can open a method in Benchmark and look through the settings. Run benchmark opens the upgrade window. The result, the chart, and the history are available once you are on Pro.
For any queries or support regarding Method Studio feature, please refer to our Support section or visit our FAQ page.